Matplotlib Simple Basic Program: Lets try various line styles
1. import matplotlib.pyplot as plt
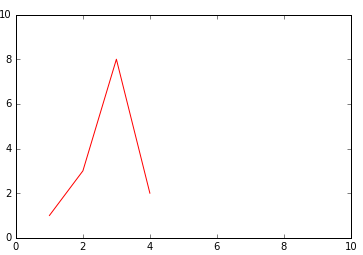
2. plt.plot([1,2,3,4],[1,3,8,2]')
3. plt.axis([0,10,0,10])
4. plt.show()
Lets know step by step:
1. import required library i.e here we want pyplot
2. plot() -> awsome method...
syntax:
plot(<values of x axis>,<values of y axis>,<style and format>)
So here x values are [1,2,3,4] and y values are [1,3,8,2] it means plot method will map values of x to y as in sequence i.e. (1,1),(2,3),(3,8),(4,2)
3. axis() -> by default length of x and y axis are as much as required only. But you can still specify how much you want.
syntax: axis(<list specifying range of x,y>)
i.e. axis([<begin_x>,<end_x>,<begin_y>,<end_y>])
So here we will draw x axis ranging from 0 to 10 and y from 0 to 10
4. Finally show() will actually plot on screen. :)
Output:

2. plt.plot([1,2,3,4],[1,3,8,2],"r-") 3. plt.plot([1,4,7,9],[1,3,8,2],"r--")

4. "gr-." : green color Dashed Dot 5. 'c:' cyan dotted line style


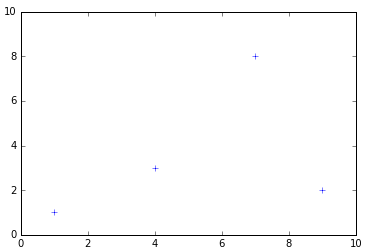
6. 'm.' : magenta point marker 7. 'yo' yellow circle marker


8. 'kv' black triangle_down marker 9.'^' triangle_up marker


10. '<' triangle_left marker 11. '>' triangle_right marker


12. '1' tri_down marker (2,3,4 for up,left,right respectively)

13.'s' square marker 14.'p' pentagon marker


15. '*' star marker 16. 'h' hexagon1 marker


17. 'H' hexagon2 marker 18.'+' plus marker

19. 'x' x marker 20. 'D' diamond marker


21.'d' thin_diamond marker 22. '|' vline marker

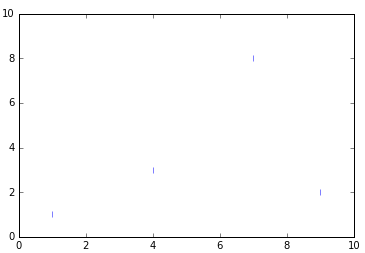
23. '_' hline marker

No comments:
Post a Comment