Sunday, November 27, 2016

MALICIOUS SOFTWARE


Definition : Any software that brings harm to a computer system.

Various Malware's:

1.Spyware :                                          
Spyware is any technology that aids in
gathering information about a person or
organization without their knowledge.


2. Logic Bomb :

code embedded in legitimate program activated when specified conditions met

3. Trojan Horse :
program with hidden side-effects which is usually superficially attractive

4.Zombie :
program which secretly takes over another networked computer

5. Virus :
a piece of self-replicating code attached
to some other code and propagate itself
by carrying codes   

6. Worms :
A standalone malware computer program that replicates itself in order to spread to other computers




Monday, November 21, 2016

SD3 Framework


SD3 Security Framework
Secure by Design:
  • Security in product development process
  • Building Threat model and threat analysis
  • conduct code reviews
  • secure architecture
  • Vulnerability reduction


Secure By Default:
  • Default installation and usage with minimum surface for attack
  • Unused feature turned off by default
  • Minimum privileges used
  • Built in functions for defense in depth


Security By Deployment:
  • protection: Detection,Defense,recovery,management,Leverage the security best practices
  • Process:  Create security guidance
  • People: build tool to access application security,give them training


What Is the Smart Grid?


The smart Grid is developing network of transmission lines,equipment,
controls and new technologies working together to respond immediately
to our 21st century demand for electricity.

Traditional about hundred yrs ago,

  • Localised Power generation
  • Small Energy Demands
  • One way interaction(From station to home)


Smart grid to meet 21st century electricity demand:
>2 way dialogue: electricity and information can be exchanged between
utilities and customers
>Developing network working together to make grid more efficient,reliable,secure,greener
>Provide newer technologies to be integrated such as Wind ,Solar productions and
Plugin electric vehical charging

>Smart home communicates with grid and enbles consumers to manage electricity usage
>By measuring home electricity consumtion frequently by using smart meter
utilities can provide much more information to customer to manage their electric bills.
>Inside smart home,through HAN device can be connected to energy managment system
>Smart appliances and devices can adjust their run schedules do reduce energy demard
at critical time and lower energy bills
>This smart devices can be scheduled over web or even over TV

>Renewable enery sources and sustainable energy sources but are variable by nature
and add complexity to normal grid operation
>Smart grid provide data and automation needed to enable solar panel and wind forms
to put enery on to grid and optimize its use
>

>Defering Electric usage


Friday, November 18, 2016

Apriori Algorithm

Apriori Algorithm

"""
output.txt
a,b,c,NaN
a,d,e,NaN
b,c,d,NaN
a,b,c,d
b,c,NaN,NaN
a,b,d,NaN
d,e,NaN,NaN
a,b,c,NaN
c,d,e,NaN
a,b,c,NaN
"""

from itertools import combinations
import pandas as pd


trans=pd.read_csv('output.txt',header=None)
print (trans)
def apriori(trans,support=0.01,minlen=1):
    ts=pd.get_dummies(trans.unstack().dropna()).groupby(level=1).sum()
    collen,rowlen=ts.shape
    pattern=[]
    for cnum in range(minlen,rowlen+1):
        for cols in combinations(ts,cnum):
            patsup=ts[list(cols)].all(axis=1).sum()
            print(patsup,'\n')
            patsup=float(patsup)/collen
            pattern.append([",".join(cols),patsup])
    sdf=pd.DataFrame(pattern,columns=['Pattern','Support'])
    results=sdf[sdf.Support >= support ]
    return results
print (apriori(trans))
ts=pd.get_dummies(trans.unstack().dropna()).groupby(level=1).sum()

collen,rowlen=ts.shape


Thursday, November 17, 2016

Matplotlib Various styles to Plot : Very SImple


Matplotlib Simple Basic Program: Lets try various line styles

1. import matplotlib.pyplot as plt
2. plt.plot([1,2,3,4],[1,3,8,2]')
3. plt.axis([0,10,0,10])
4. plt.show()

Lets know step by step:
1. import required library i.e here we want pyplot
2. plot() -> awsome method...
                   syntax:
                             plot(<values of x axis>,<values of y axis>,<style and format>)
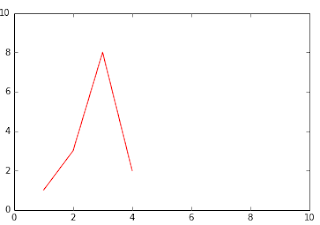
                   So here x values are [1,2,3,4] and y values are [1,3,8,2] it means plot method will map values of x to y as in sequence i.e. (1,1),(2,3),(3,8),(4,2)

 3. axis() -> by default  length of x and y axis are as much as required only. But you can still specify how much you want.
                   syntax: axis(<list specifying range of x,y>)
                         i.e. axis([<begin_x>,<end_x>,<begin_y>,<end_y>])
          So here we will draw x axis ranging from 0 to 10 and y from 0 to 10

4. Finally show() will actually plot on screen. :)

Output:


2. plt.plot([1,2,3,4],[1,3,8,2],"r-")                           3. plt.plot([1,4,7,9],[1,3,8,2],"r--")

4. "gr-." : green color Dashed Dot                            5. 'c:' cyan dotted line style


6. 'm.' : magenta point marker                                   7.  'yo' yellow circle marker  


8. 'kv' black triangle_down marker                           9.'^' triangle_up marker

10. '<' triangle_left marker                                       11. '>' triangle_right marker


12. '1' tri_down marker (2,3,4 for up,left,right respectively)


13.'s' square marker                                                14.'p' pentagon marker

15. '*' star marker                                                      16. 'h' hexagon1 marker

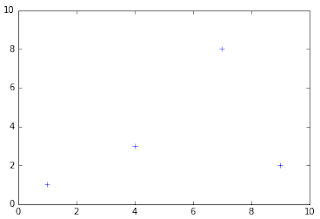
17. 'H' hexagon2 marker                                          18.'+' plus marker


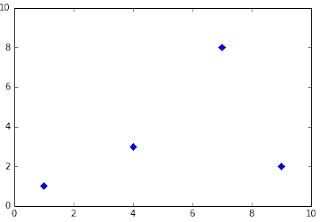
19. 'x' x marker                                                        20. 'D' diamond marker

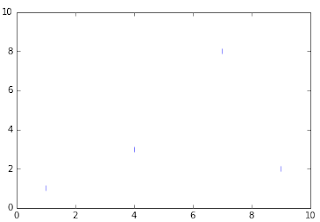
21.'d' thin_diamond marker                                      22. '|' vline marker

23. '_' hline marker